FiDA launched the first Digital Finance Evidence Gap Map (EGM) in November 2017 with 40 studies, covering 41 different products. A year on, the EGM includes 55 studies, covering 60 products. Each year reveals more insights on the impact of various digital finance products.
In the coming weeks, FiDA is publishing a Digital Finance Evidence mini series on various insights derived from an analysis of the latest EGM update. These will include impact insights on digital savings, credit, and payments and transfers products; how various products have been designed and delivered; and where (people and location) we have been looking for impact.
Bringing impact insights together
In 2017, The FiDA Partnership embarked on a journey to answer the question: ‘What is the impact of digital finance on low-income clients?’
The complexity of this question was clear. Digital finance is not ‘one thing’, it is dozens of products, designed and delivered in various ways, to various client segments, in various markets. A single study cannot answer this question. Yet, as we aggregate the various impact insights by product and place them in dialogue with each other we are coming closer to the answer.
FiDA’s contribution to the impact conversation: the EGM
To encourage a continuous dialogue on impact, FiDA developed the EGM. After defining our methodology, we screened, coded, and folded digital finance impact insights into the EGM. At its simplest level, the EGM charts the landscape of impact evidence—be it positive, negative, or null—for a set of digital finance products, plotted against a set of client outcomes. However its interactive design and filters enable users to scan for evidence for questions as specific as ‘Does X product, designed with Y features, delivered in Z ways, to clients in A market lead to B outcomes?’ Thus, if you wanted to search for evidence on a digital credit product using two-way SMS in Ghana, you can—provided such a product has been developed and tested and the resulting insights published.
Using the EGM
We envision several ways in which various types of users might use and benefit from the EGM:
Digital finance product and service developers and practitioners
- Search for evidence of what has been shown to have client level impact, to inform current and future digital finance products.
- Derive insights on which design and delivery mechanisms have (or have not) improved the adoption of a given digital finance product.
- Use evidence to advocate and fundraise for new approaches in areas where there is little evidence(and thus help fill an evidence gap) or to scale existing products.
- As the EGM folds in more studies over time, it may reach a level of evidence saturation that will allow practitioners to develop guidelines for practice in areas where there is substantial evidence of what works.
Digital finance investors
- Help make evidence-based, strategic investments in areas where there is ample, high-confidence evidence of what works, what is unknown, and what is untested.
Donors
- Identify and support the development of a body of practice in infrequently explored areas by funding programs and or research, where there is little evidence on a product, a population segment or a market.
Digital finance researchers
- Conduct an evidence synthesis on a digital finance product, a client segment, or a market.
- Review gaps in evidence on various products, populations, or markets and make investments to advance the impact conversation.
What is in the latest version of the EGM?
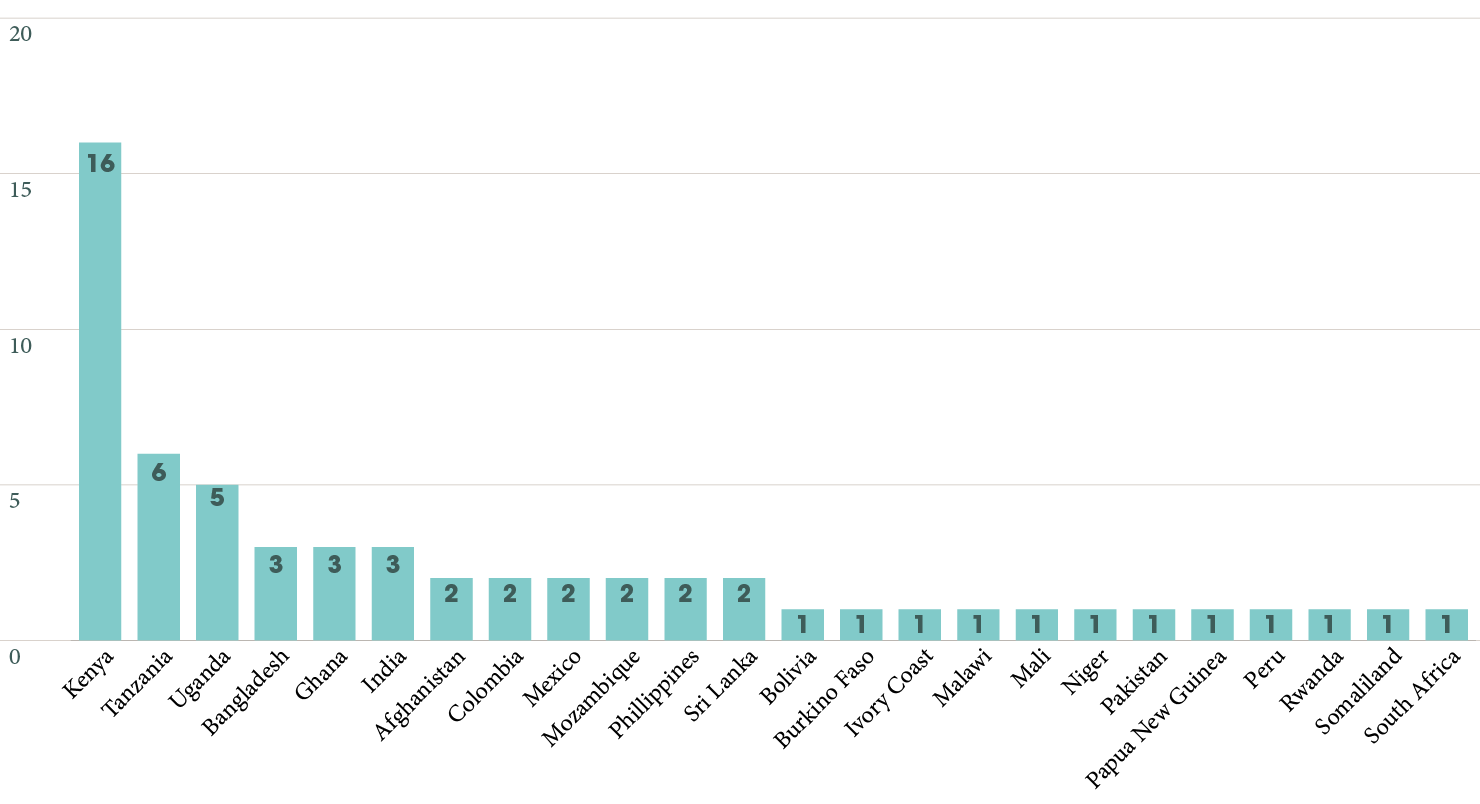
In the updated EGM there are 55 studies that test 60 digital finance products and interventions from 24 Countries. There are 14 digital finance products and 28 design and delivery mechanisms with various counts of evidence. Study design includes RCTs (23%), panels (18%) cross sections (18%), provider data (10%), A/B tests (8%) and mixed methods (8%). Here, we share some high level findings, which we will investigate further in the forthcoming series.
Geography: While 24 countries are represented in the EGM, Kenya alone accounts for over a quarter of the studies (27%), the East Africa region accounting for over half (52%) of the impact literature.
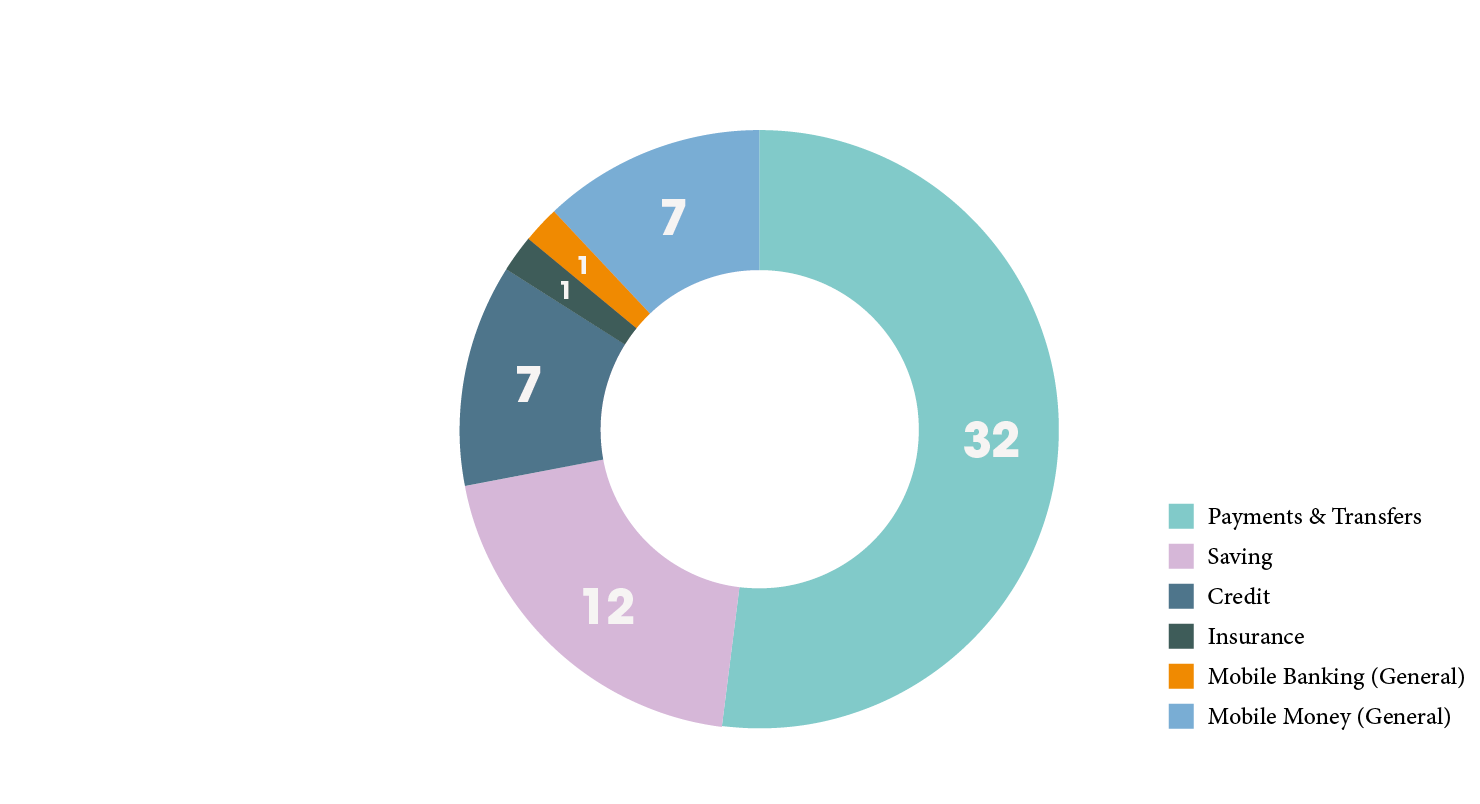
Digital finance products: Across the 55 studies, 60 digital finance products were evaluated. Digital payments and transfers account for 52% (n=31) of the impact literature. When general mobile money studies (i.e., studies that did not specify the mobile money product used) are included in this category, this increased to 65% (n=39) of studies.
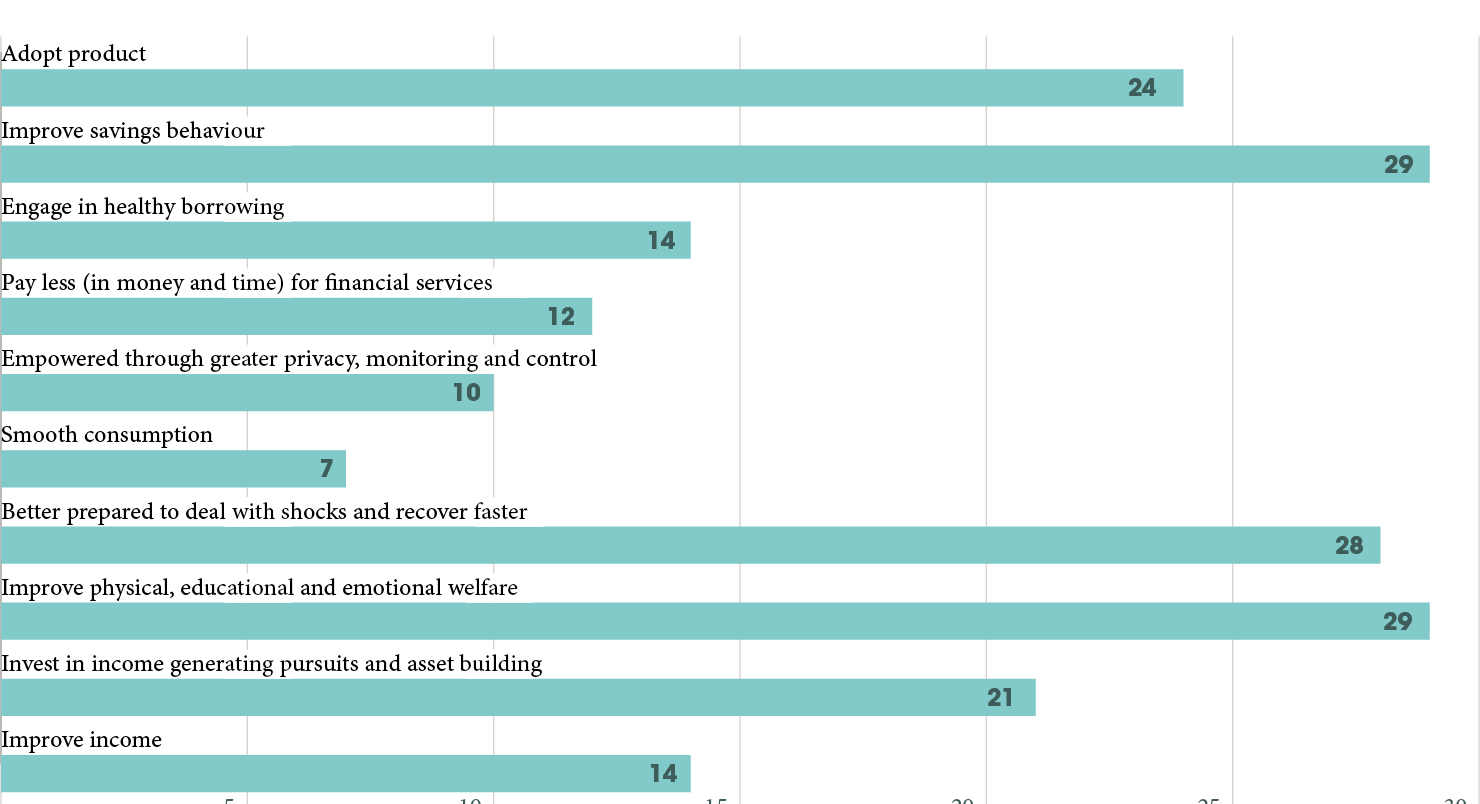
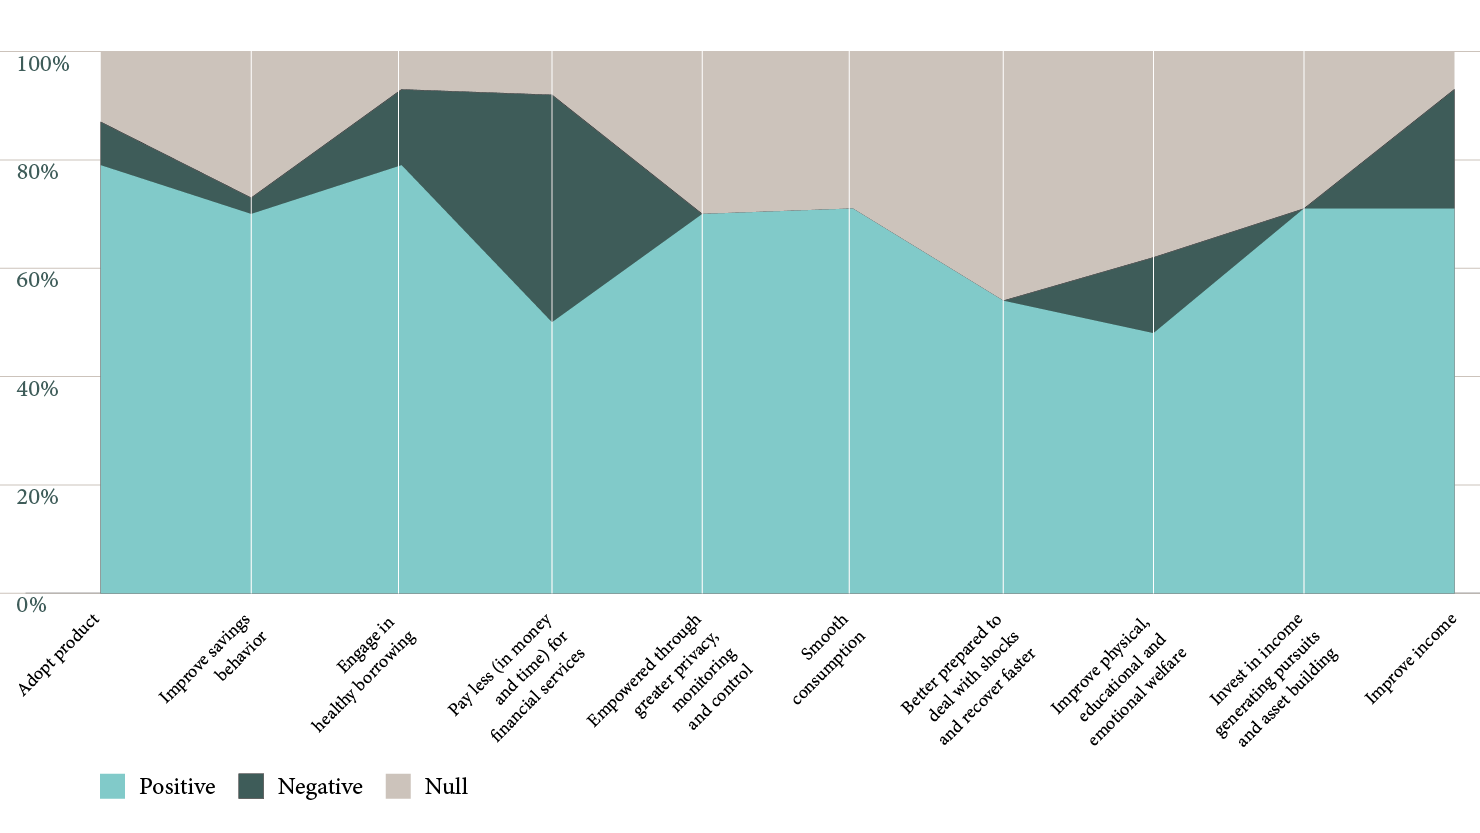
Client outcomes: Across the 55 studies, there are 188 ‘tests’ linked to the 10 client outcomes. The tests are more concentrated at immediate outcomes (adoption: 13% and savings behavior: 16%) and longer term outcomes (resilience: 15%, welfare:16%, and income investing/asset building:11%). The outcomes vary at a product level analysis.
Positive leaning results but mixed at a product level examination. While the number of studies currently available is small, considering the growth and diversity of digital finance products, we observe positive, negative, and null effects across the various digital finance products on various client outcomes. 65% of the reported tests were positive, 9% were negative, and 26% were null. However, when we review product level effects in the coming series, we will see that this proportion is varied. For example, when we look at credit products, 57% of the tests are positive, 19% negative and 24% null.
It is important to state that this does not mean digital finance products ‘work’ 65% of the time or digital credit ‘works’ 57% of the time. We are looking at 60 different products where, in aggregate, 188 tests on various outcomes were examined. On average, a single study did three outcome tests (ranged from 1 to 13). Across the 60 products examined, 55% (33) reported exclusively positive results, 0% reported exclusively negative results, 7%(4) reported exclusively null results, while 38% (23) reported a mix of positive, negative, and null results. Just one study reported only negative or null findings. So in 38% of products, some outcomes improve, some are unchanged, and a few regress.
We are at the beginning of our journey toward understanding the impact of various digital finance products. Researchers are, and should be, casting their nets wide—testing a broad range of outcomes—to interrogate various theories around the impact of various products. If a product tested two outcomes and found no effects, it does not mean that the product does not move the dial at all, but rather that what it may move the dial on was not examined. Choosing what to test is important.We refine these choices through continued testing and learning.
We have much to learn as a community; but the digital finance EGM collates our learnings so that we can better approach an answer to the impact question. As more products are tested, and the findings published, we can form impact pathways for each type of digital finance product and provide the community with a tool to delve into the design and delivery mechanism, the market, and the social conditions in which the digital finance product was (or was not) successful in catalyzing change.
The studies in the EGM, represent our best knowledge of digital finance impact insights. New studies are ever emerging and thus the EGM will continue to evolve. If you have questions on the EGM, are interested in discussing research priorities, or know of relevant Digital Finance impact studies that meet the inclusion criteria, please contact ideas@financedigitalafrica.org.